Web-based app · Now in beta
CBM Benchmark Reporting
Turn your Fall, Winter and Spring CBM scores into local school, district and comparisons to Hasbrouck-Tindal CBM norms, with clear box-and-whisker reports for every student, class and school. Includes a Reading Survey Level Assessment (SLA) to find each struggling reader's PLAAFP.
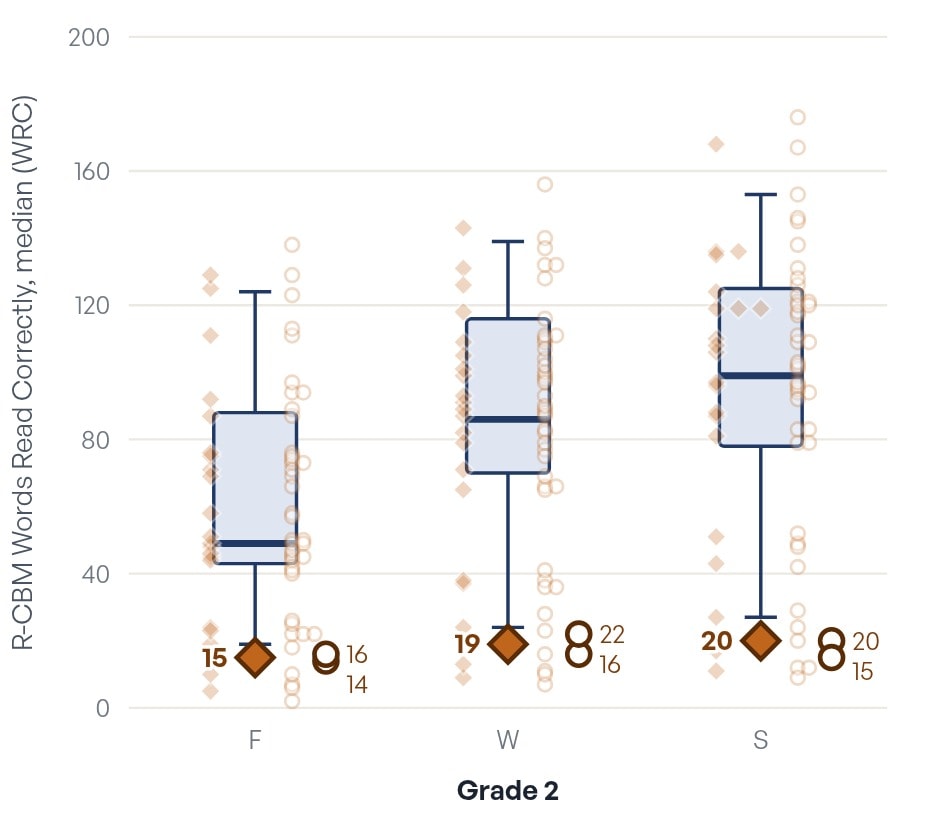
Box: 25th to 75th percentile, line at the median. Whiskers: 10th and 90th percentiles. The diamond marks the student's median score. Fictional demonstration data.
Now seeking 20 beta testers. Beta testers use it free.
Learn how to apply →Developed by Mark R. Shinn, Ph.D.
What the App Helps You Do
CBM Benchmark Reporting was developed so school teams can see how each student is performing compared with students in their own school, district, and Hasbrouck Tindal norms three times a year with ORF (R-CBM) data you already have or adding Highly Decodable Passages data for Kindergarten and Grade 1 students and S-CBM and WE-CBM.
Universal screening
Benchmark every student in Fall, Winter and Spring with R-CBM, HD R-CBM, S-CBM and WE-CBM.
Identify students at risk
See right away which students fall below the 10th and 25th percentiles of local peers.
Universal Progress Monitoring
See growth and development Fall to Winter to End of Year.
Local and national comparisons
Compare students with school and district norms, with optional Hasbrouck & Tindal (2017) R-CBM norms.
Key Features
Built for Clean, Trustworthy Data
Excel and CSV upload only
No online score entry, so there are fewer places for errors to get into your data.
District, School and Class workbooks
Enter districts, schools, teachers and students once a year. Each Benchmark Period has its own color-coded tab.
Upload the same workbook each period
Add Winter or Spring scores and upload again. Only the new scores are added.
School, district and composite norms
Minimum sample sizes: 20 for a school, 50 for a district and 100 for the composite.
Qualitative Features Checklist
Observed or Not Observed reading behaviors, reported below each student's chart. Not normed.
Student privacy
Student names stay on your computer and are never uploaded. Student IDs are scrambled.
Survey Level Assessment (SLA)
For students at or below the 25th percentile, test R-CBM at lower grades until a score is above the 40th percentile and get the student's PLAAFP. Also sold as a stand-alone app.
Student, Class and School Reports
Each student's score is plotted against the 10th, 25th, 50th, 75th and 90th percentiles of local peers, with every R-CBM passage score shown. The Qualitative Features Checklist appears right below the chart.
Class, school and district tables show each student's percentile rank in a color-coded range:
Print reports or export them to CSV for team meetings and Board reports.
NEW · SURVEY LEVEL ASSESSMENT
Find Each Struggling Reader's PLAAFP
For students whose R-CBM score at their grade is at or below the 25th percentile of the Hasbrouck and Tindal norms, click Start SLA in the class report. Enter R-CBM scores from the next lower grade, and the next, until the median is above the 40th percentile for that grade. That grade is labeled the Present Level of Academic and Functional Performance (PLAAFP). Every score is plotted against Hasbrouck and Tindal Fall, Winter and Spring norms with a line through the student's median; the box where the student is in the average range is green. Qualitative Features observed at each grade are reported in the PLAAFP statement.
Also available as a stand-alone app. The Reading Survey Level Assessment can be purchased on its own for staff who need SLAs for individual students without the full benchmark reporting suite.
Learn about the stand-alone Reading SLA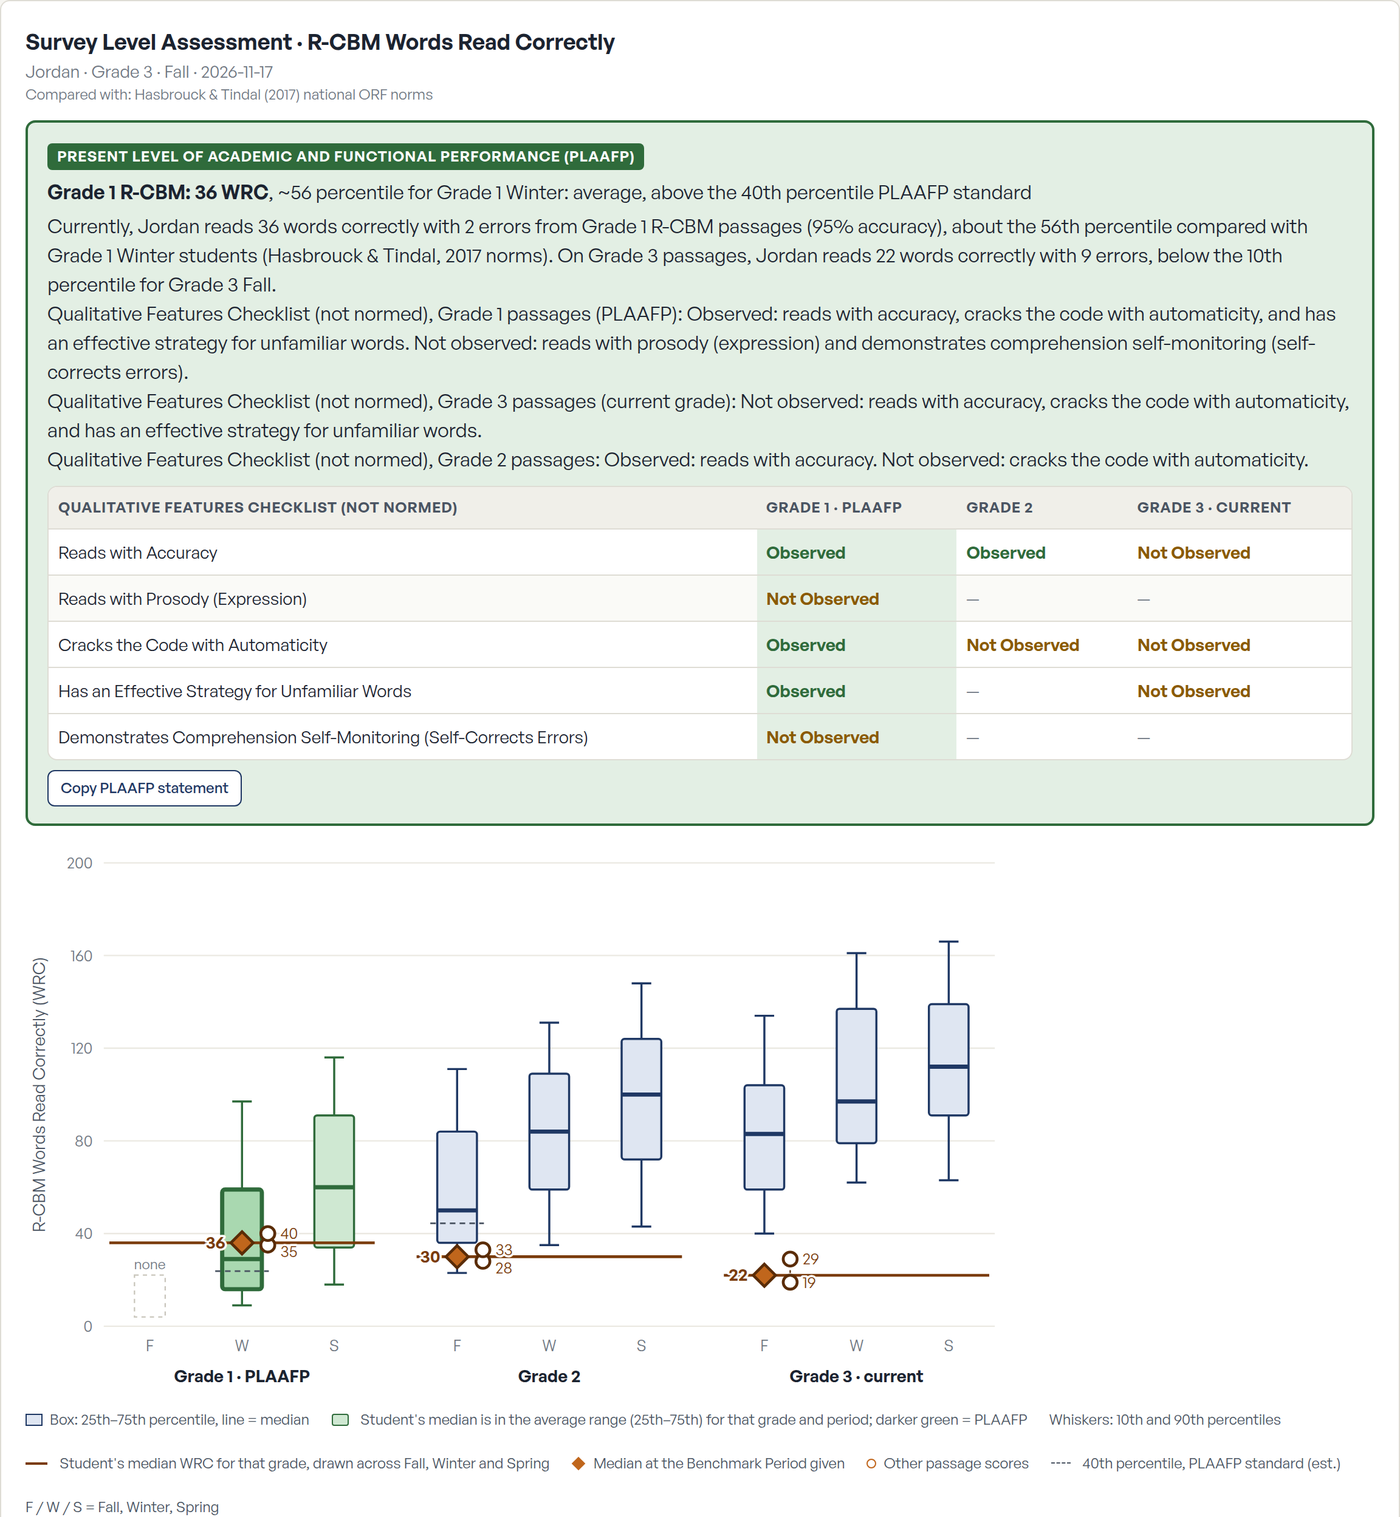
Example SLA report. Fictional demonstration data.
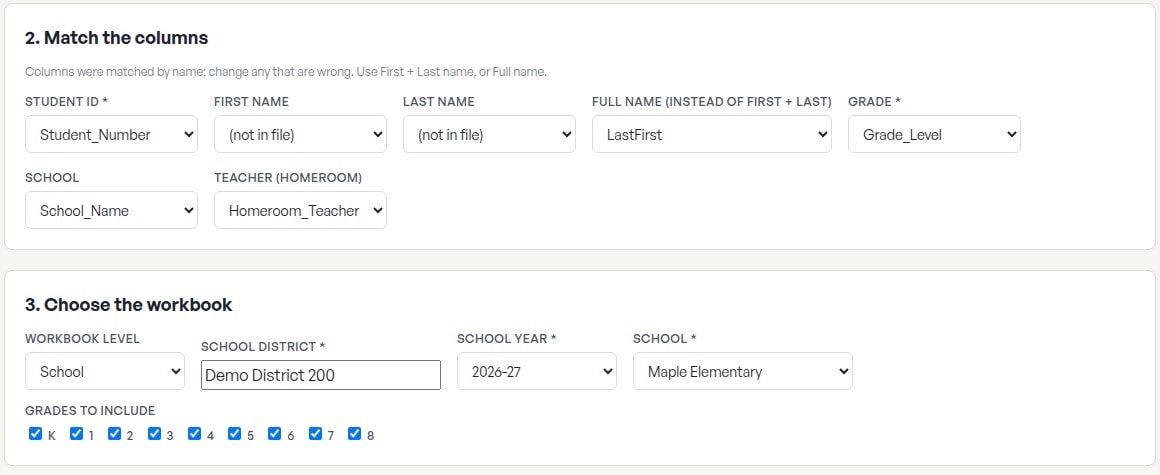
Import Your Roster from Your School Data System
Skip typing names. Export a student list from your school data system, choose it in the app, and download a District, School or Class workbook with the roster already filled in.
- PowerSchool, Infinite Campus, Skyward, Synergy, Aeries and other systems (CSV or Excel)
- Clever or ClassLink (OneRoster files)
- Columns are matched automatically; you can change any match
- The file is read on your computer only. Nothing is uploaded.
Measures and Materials
Use the CBM Materials Available Here at markshinn.org
CBM Benchmark Reporting works with four CBM measures. The HD Passages, S-CBM Spelling Lists and WE-CBM Story Starters can be purchased right here at markshinn.org.
| Measure | What is scored | Materials |
|---|---|---|
| HD R-CBM | High Decodable passages for Kindergarten (Winter, Spring) and Grade 1 (Fall, Winter, Spring): words read correctly, errors and accuracy for up to 3 passages | Buy HD Passages |
| S-CBM | Spelling: words spelled correctly (WSC) and correct letter sequences (CLS) | Buy S-CBM Spelling Lists |
| WE-CBM | Written Expression: total words written (TWW) and words spelled correctly (WSC) | Buy WE-CBM Story Starters |
| R-CBM | Up to 3 passages: median words read correctly (WRC), errors and accuracy | Use your district's R-CBM passages |
All scores are rounded to whole numbers. Norms are reported for WRC, WSC, CLS and TWW; errors and accuracy are reported as values only.
Get CBM Benchmark Reporting
One-Time Purchase. No Subscription.
Buy a license, then open cbmmarkshinn.org, enter the license key from your receipt email, and create your account.
School District or Organization
$99.99
Staff across one school district or organization, up to 75 computers
Buy School District or OrganizationEvery license includes the full app. Licenses differ only in how many computers can be activated.
Beta Program
Seeking 20 Beta Testers. Free.
Dr. Shinn is looking for 20 schools or districts to use CBM Benchmark Reporting with their own benchmark data and share what works and what to improve. Beta testers use CBM Benchmark Reporting free.
- Your school or district gives R-CBM, HD R-CBM, S-CBM or WE-CBM benchmarks
- You can upload Fall, Winter and Spring scores from Excel or CSV
- You are willing to share feedback during the school year
20
free beta tester openings
Accepted beta testers receive a beta code that makes the license free at checkout.
CBM Benchmark Reporting is a product of Data-Based Consulting, Inc. View All Products